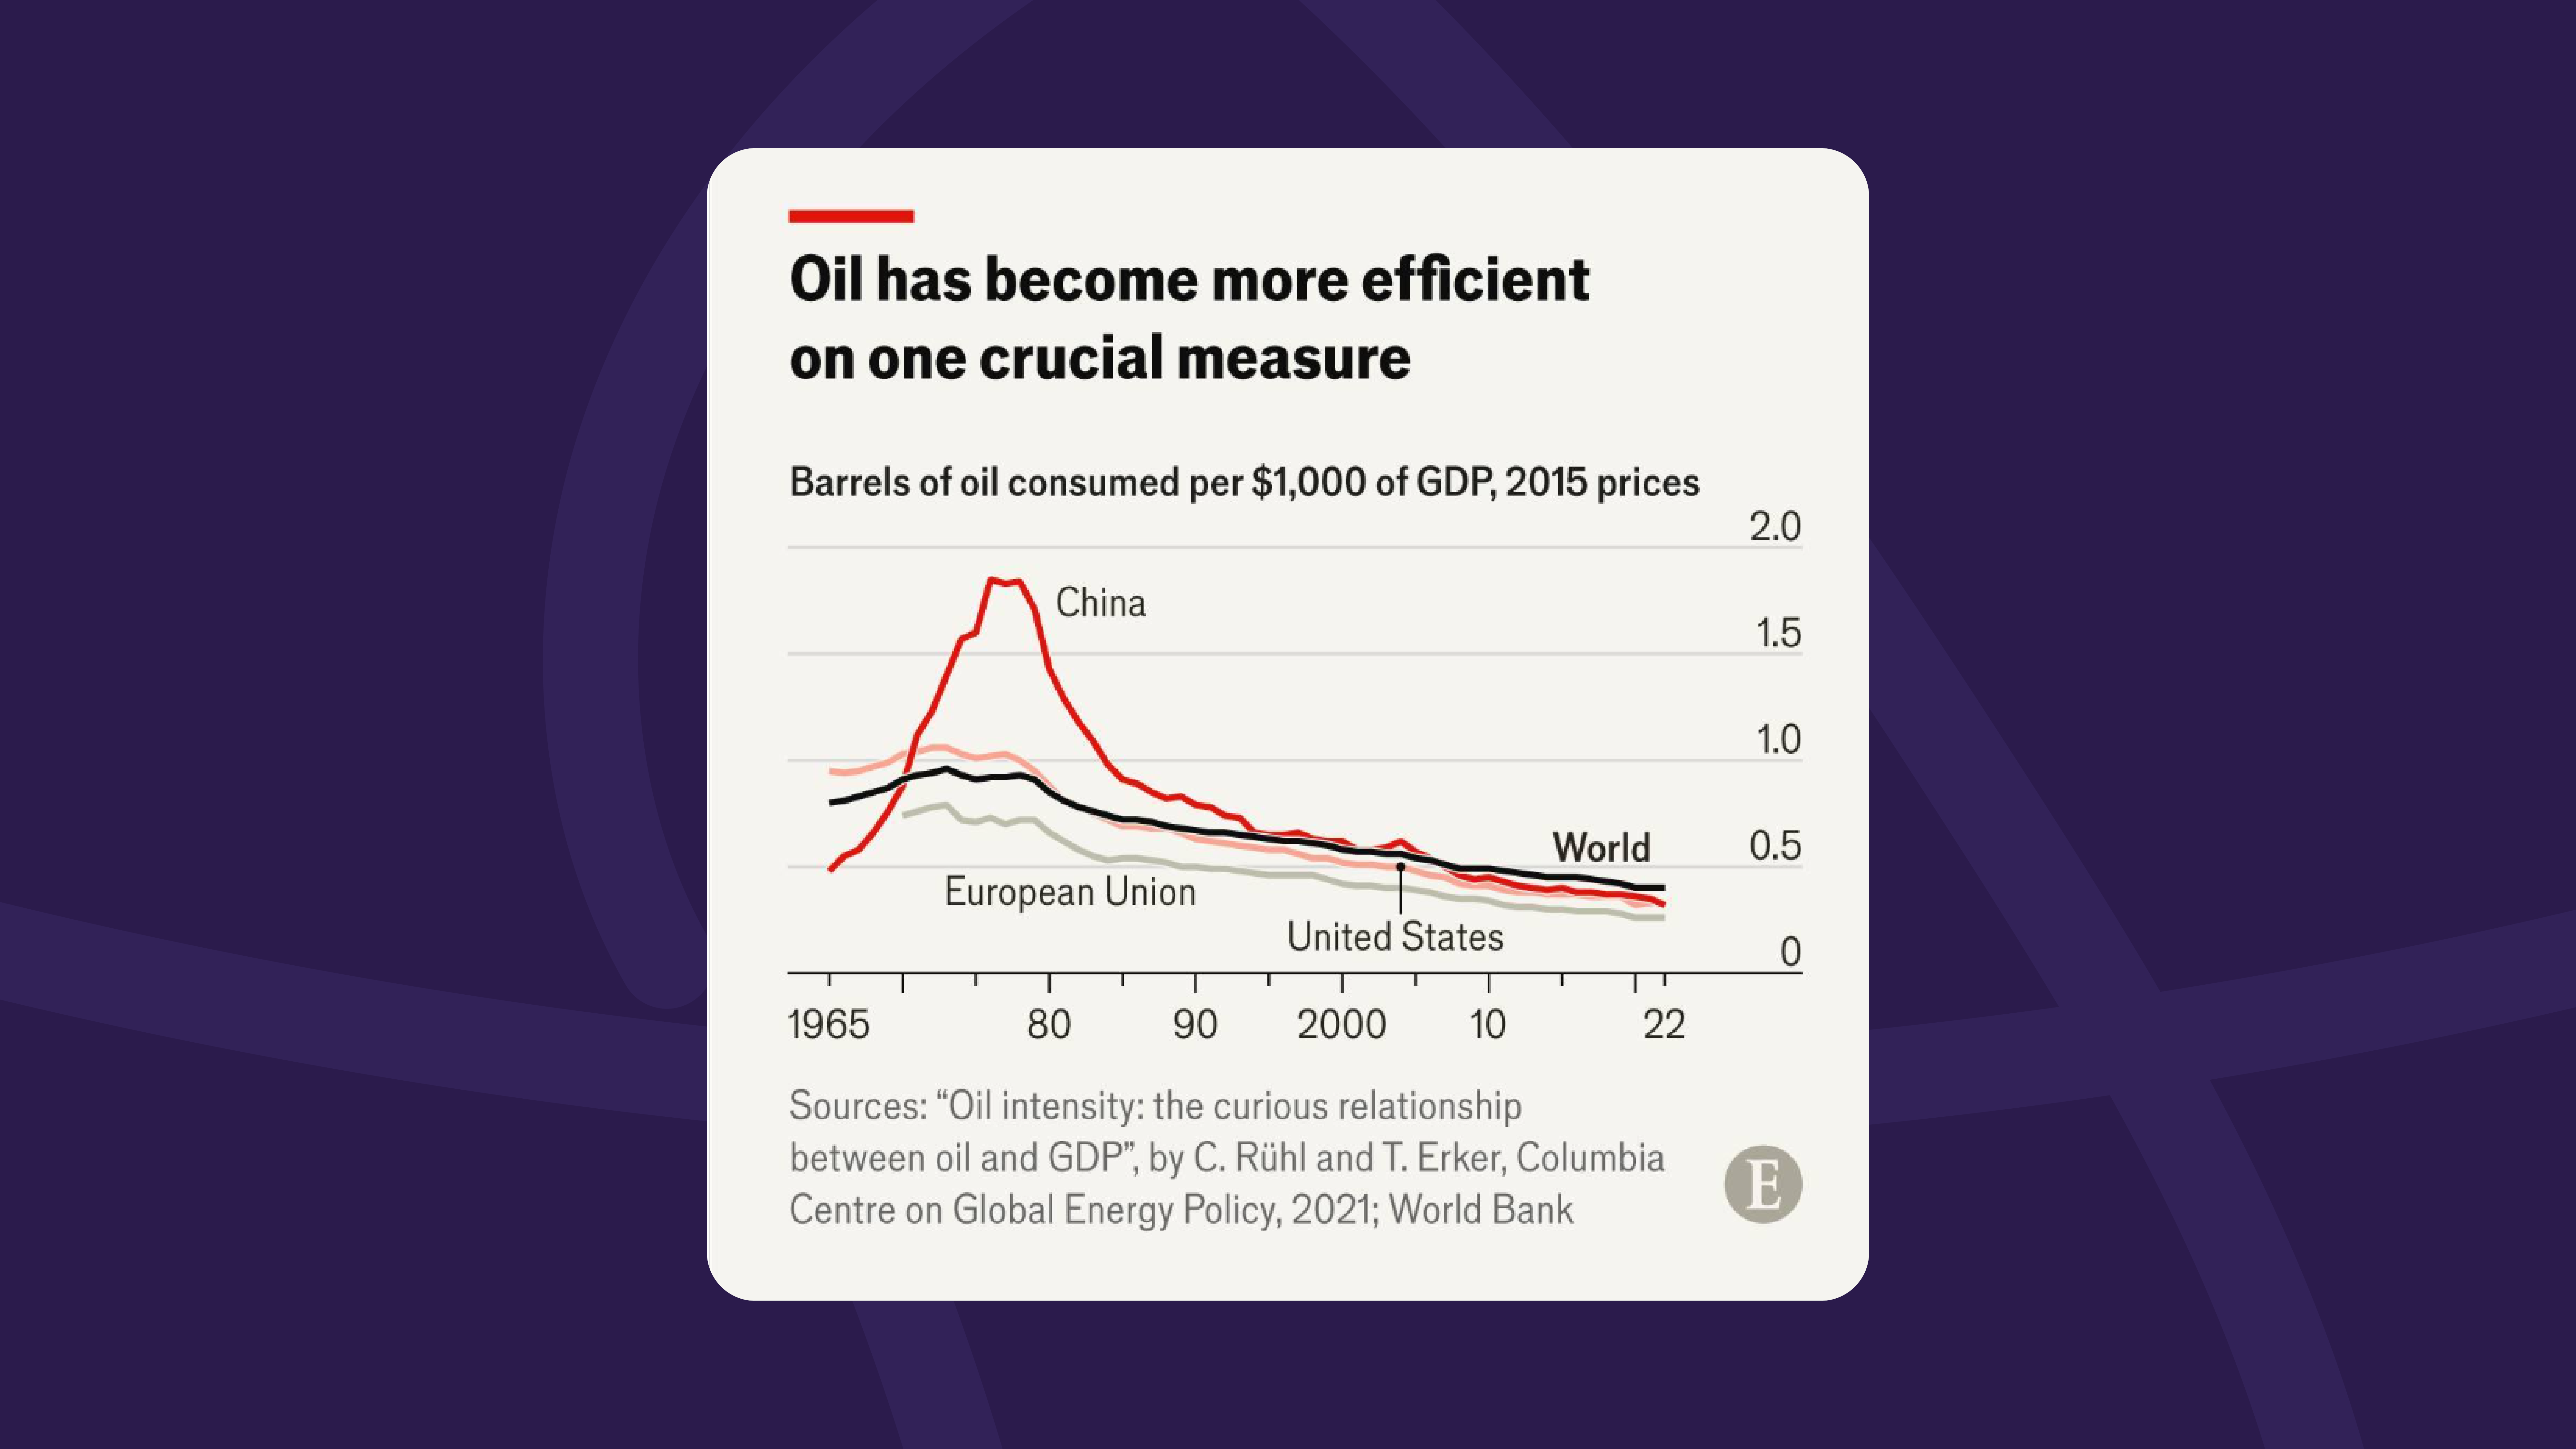
Data visualization

Narrative

  • Narrative gives meaning: Data alone is numbers; a story connects them to context and purpose.
  • Guides attention: A clear narrative directs the audience to the most important insights.
  • Builds retention: People remember stories more than statistics—narratives make findings stick.
  • Creates coherence: Narrative ties multiple visuals together into one understandable message.
  • Drives decisions: A strong story transforms data from abstract facts into actionable insights.
  • Human connection: Narrative makes data relatable, bridging the gap between analysis and real-world impact.

Narrative

Known Styles

  • The economist
  • the new york times
  • The financial times

Economist = minimalist authority

NYT = narrative elegance

FT = brand consistency (pink)

Guardian = approachable boldness

Bloomberg = energetic tech-driven

The economist

The Economist

The Economist

Qualities: Minimalist, functional, restrained use of color (often red for emphasis), clean typography, small multiples, clear legends.

Effect: A no-nonsense, analytical style that conveys authority and efficiency.

see https://medium.economist.com/charting-new-territory-7f5afb293270

The Financial Times

Financial Times

Financial Times

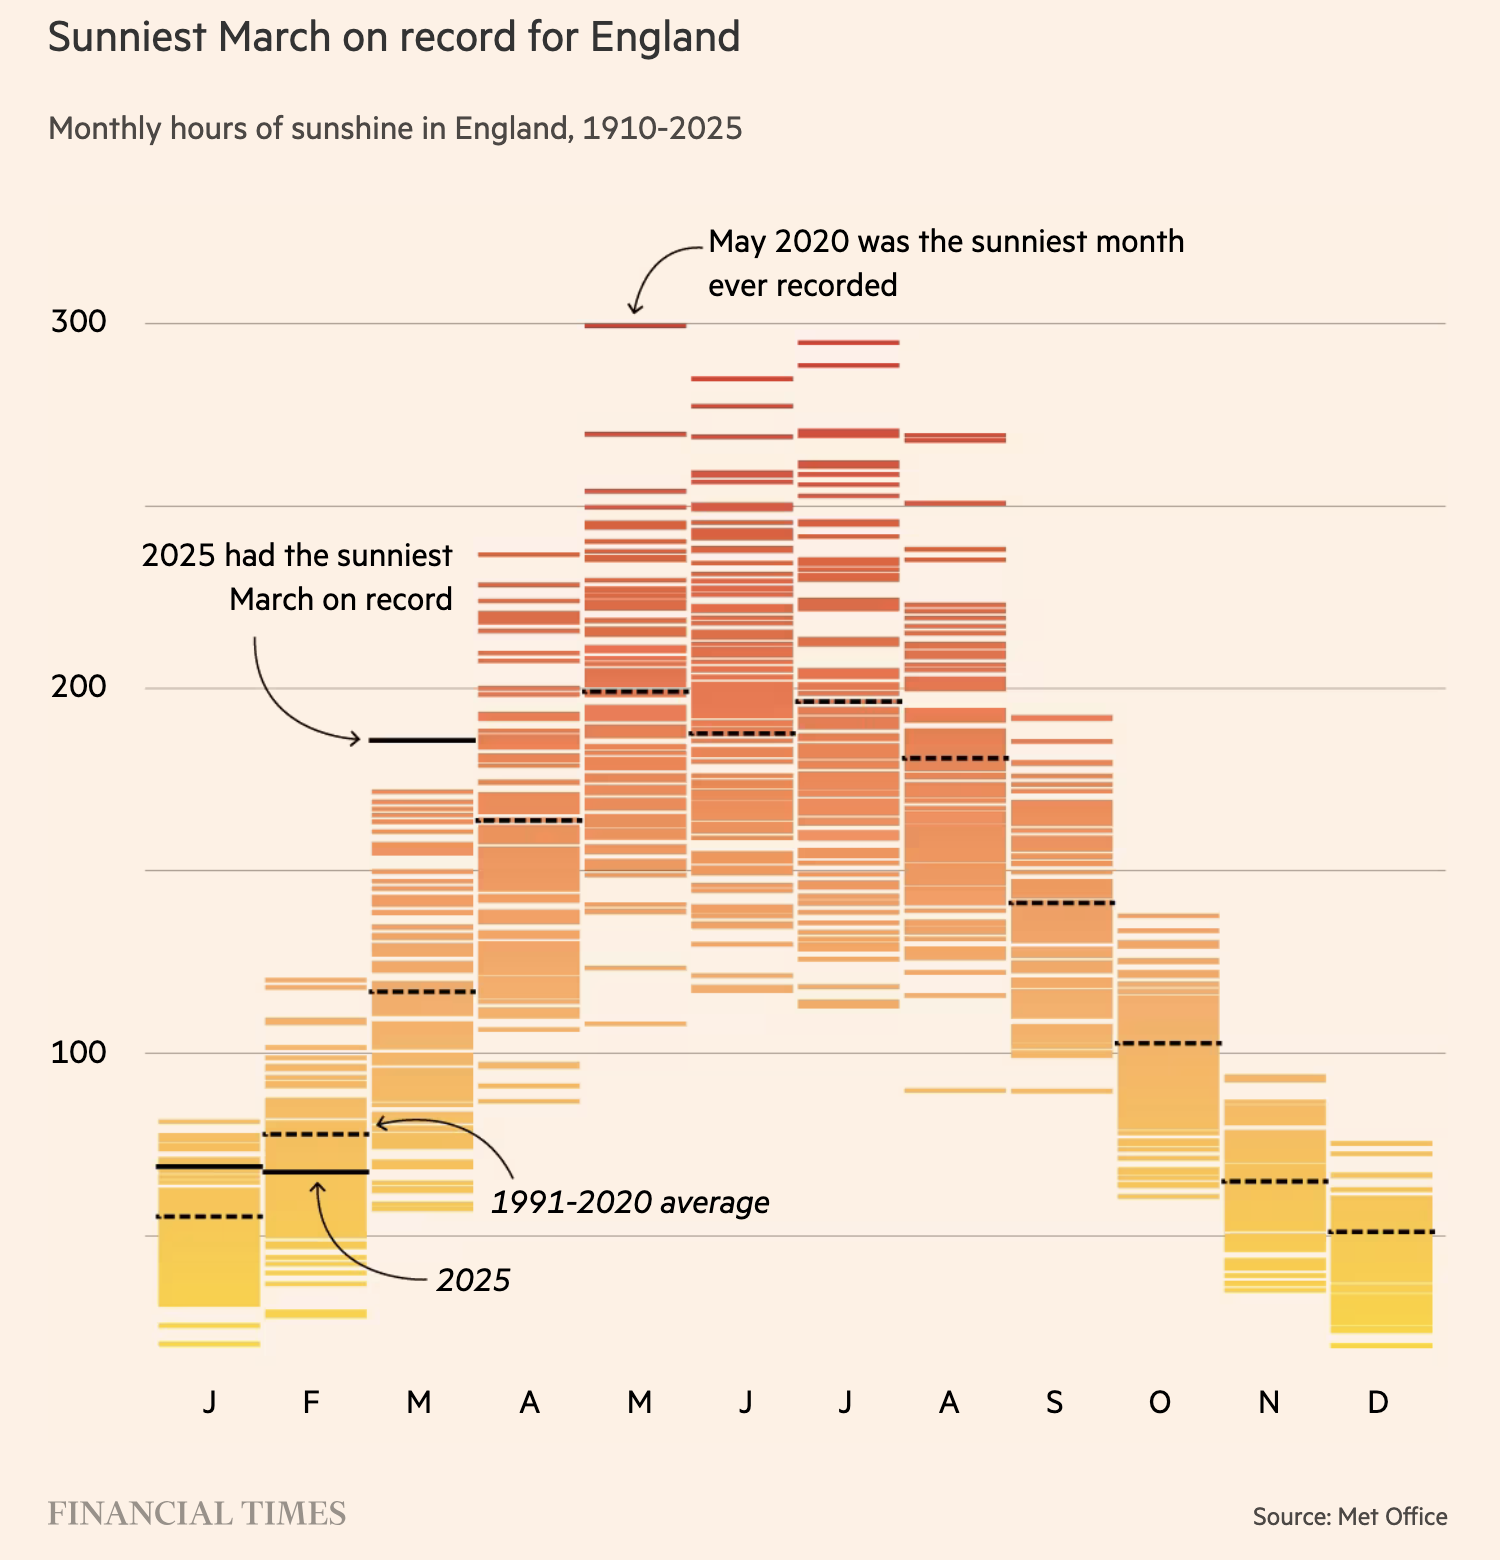
Qualities: Recognizable pink background, consistent color palettes, emphasis on clarity. Uses subtle but distinctive styling choices.

Effect: Reliable, instantly recognizable, visually branded around “FT pink.”

Mistakes

Truncating scale

Truncating scale

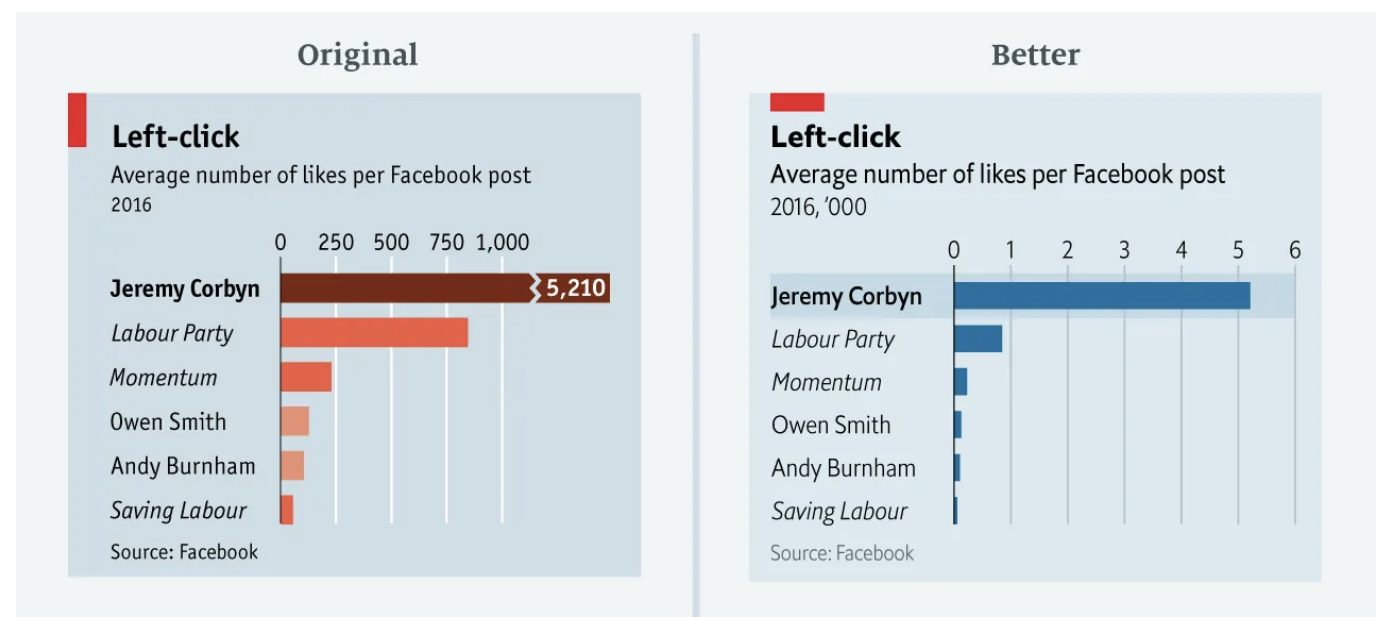
The original chart not only downplays the number of Mr Corbyn’s likes but also exaggerates those on other posts. In the redesigned version, we show Mr Corbyn’s bar in its entirety. All other bars remain visible

Another odd thing is the choice of colour. In an attempt to emulate Labour’s colour scheme, we used three shades of orange/red to distinguish between Jeremy Corbyn, other MPs and parties/groups. We don’t explain this. While the logic behind the colours might be obvious to a lot of readers, it perhaps makes little sense for those less familiar with British politics.

read: https://medium.economist.com/mistakes-weve-drawn-a-few-8cdd8a42d368
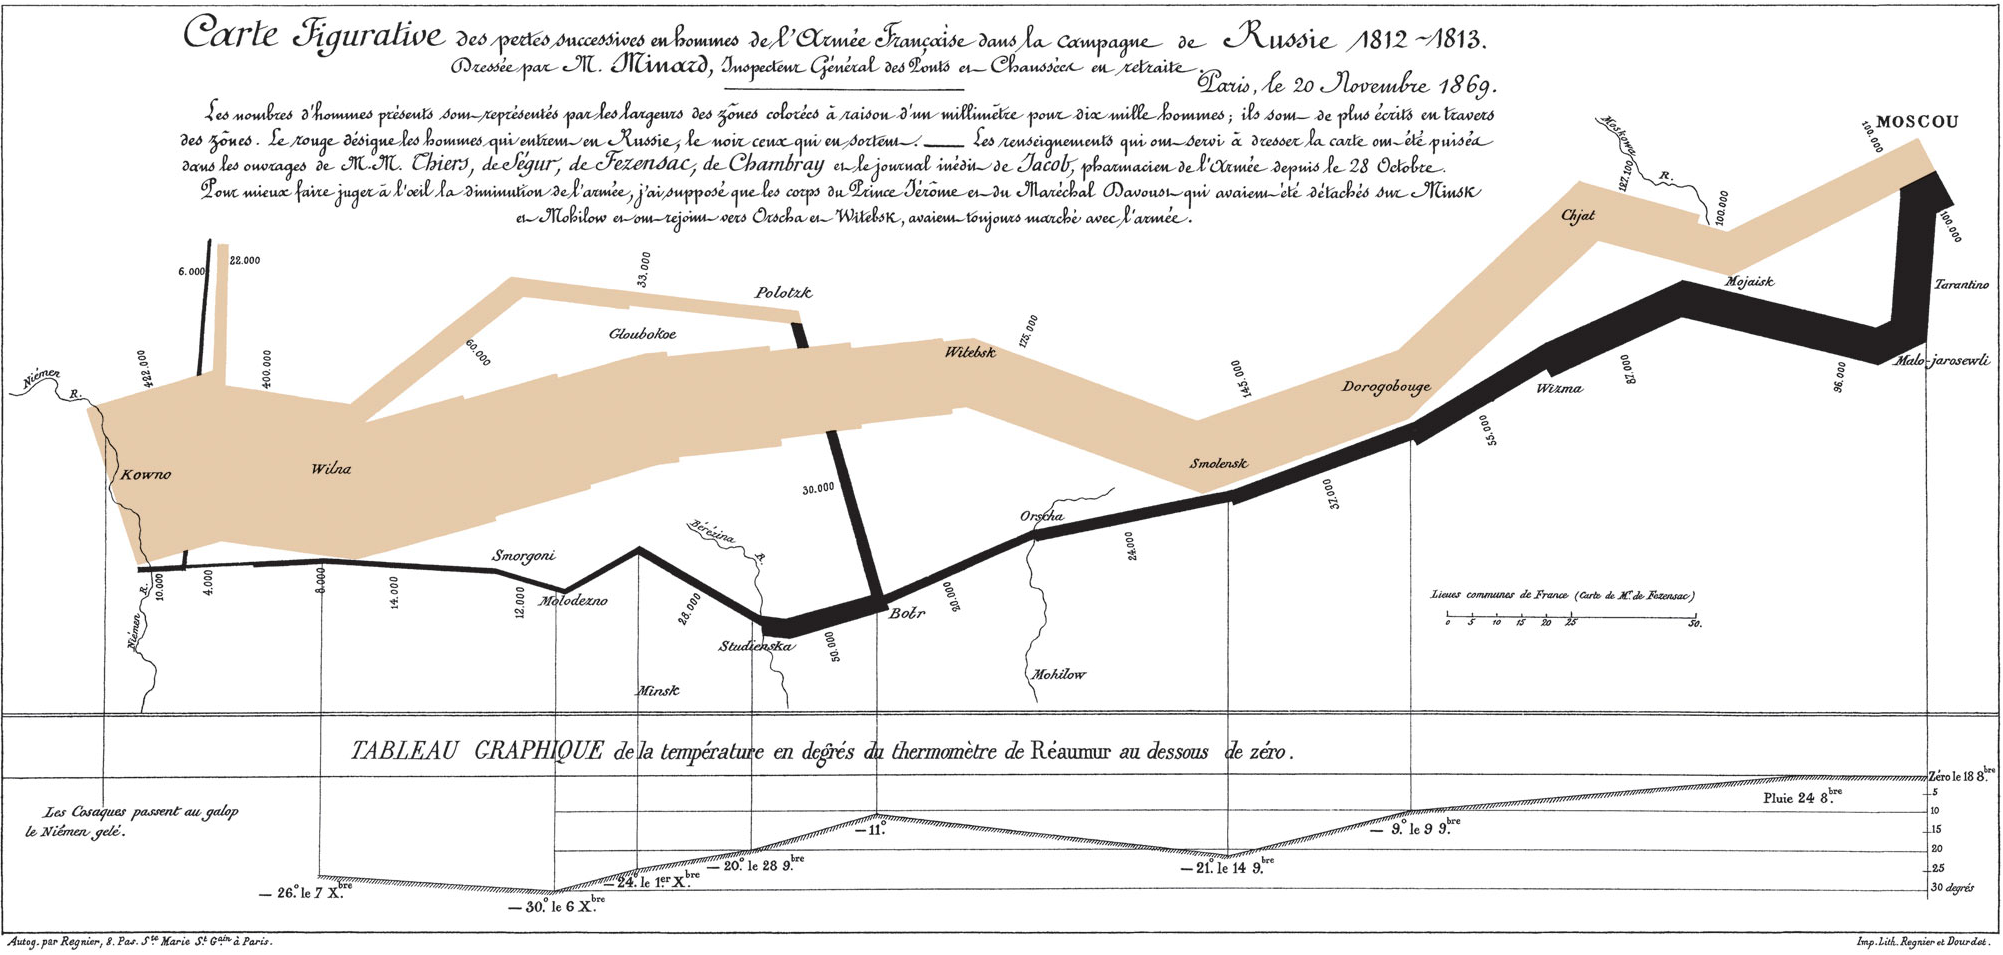
What makes a good chart

LESS IS MORE

Perfection is achieved not when there is nothing more to add, but when there is nothing left to take away.

Antoine de St Exupery

Rules for Good Charts

Clarity first → Remove clutter (3D effects, unnecessary gridlines, distracting colors).

Use the right chart for the data → Match chart type to relationship (time → line, distribution → histogram, comparison → bar, part-to-whole → pie/stacked bar, flow → Sankey, etc.).

Highlight the key point → Use color, annotation, or emphasis to guide the eye to the insight, not just the numbers.

Respect perception → Human brains read length and position best (bars, lines), then area, then color. Avoid misleading scales (e.g., truncated axes).

Consistency matters → Keep fonts, scales, and colors consistent across visuals to aid understanding.

Rules for Data Narrative

Start with the “so what” → What does the data show that matters? Frame the narrative around that.

Guide attention step by step → Lead the audience through the story, don’t dump everything at once.

Balance detail and simplicity → Enough context to be credible, but not so much that the story gets buried.

Make it relatable → Use comparisons, analogies, or human-centered framing (“this is like…”) to bridge numbers and meaning.

Connect charts into a flow → Each visualization should be a “scene” in the story, not an isolated graphic.

End with insight or action → Every data story should lead to a conclusion, recommendation, or question.

⚖️ Rules for Honesty

Don’t cherry-pick → Select data fairly, not just to prove your point.

Keep scales honest → Axes should not distort magnitude (classic trap: truncated y-axis).

Disclose uncertainty → If the data has margins of error, acknowledge them.

Show proportionality → Area, length, and color should reflect actual differences in magnitude.

to sum up

👉 Put simply:

Good charts = clear, accurate, and well-matched to the data.

Good narratives = purpose-driven, guiding the audience from question to insight.

📊 10 Rules for Good Charts & Data Narrative

Start with the key message – define the so what before designing.

Choose the right chart – match the visual form to the data relationship.

Keep it simple – avoid clutter, 3D effects, and decorative noise.

Guide the eye – use color, size, or annotations to highlight insights.

Respect perception – prefer length and position over area or color.

Stay consistent – use uniform fonts, scales, and palettes.

Be honest – no misleading axes, cherry-picking, or distortions.

Show uncertainty – include margins of error or confidence intervals when relevant.

Build a narrative flow – each chart should be a scene in the story.

End with insight or action – make the data meaningful and actionable.

Edward Tufte

American statistician and professor of political science, statistics, and computer science at Yale University 1983 Edward Tufte, The Visual Display of Quantitative Information Expert in Visual communication of information Chartjunk: all visual elements in charts and graphs that are not necessary to comprehend the information represented on the graph, or that distract the viewer from this information

https://en.wikipedia.org/wiki/Edward_Tufte

Pie charts

ineficient, avoid if possible

Pie charts are evil. They represent much of what is wrong with the poor design of many websites and software applications. They ʹ re also innefective, misleading, and innacurate. Using a pie chart as your graph of choice to visually display important statistics and information demonstrates either a lack of knowledge, laziness, or poor design skills.

read : https://www.businessinsider.com/pie-charts-are-the-worst-2013-6

Napoleon

Napoleon

Types of charts

  • scatterplots
  • barcharts
  • line charts
  • histograms
  • boxplots

Scatterplots

Definition: Show individual data points on two axes (x and y).

Use when: Exploring relationships or correlations between two variables.

Bar Charts

Definition: Rectangles representing categorical values.

Use when: Comparing quantities across categories.

Line Charts

Definition: Points connected by lines to show change over time.

Use when: Tracking trends or evolution across ordered intervals.

Histograms

Definition: Bars representing frequency of values in bins.

Use when: Showing the distribution of a continuous variable.

Boxplots

Definition: Summarize data with median, quartiles, and outliers.

Use when: Comparing distributions or spotting variability/outliers.

TODO : add visuals

Python

Seaborn — High quality static stats graphics.

Use for: fast EDA, publication-ready plots with good defaults.

Pros: smart statistical defaults, consistent style. Cons: less interactive.

Plotly / Plotly Express — Best all-around interactivity.

Use for: dashboards, hover/tooltips, zoom, sharing HTML.

Pros: rich interactivity, wide chart coverage. Cons: heavier payloads.

Matplotlib — Low-level control + reliability.

Use for: custom/static figures, journals, edge cases.

Pros: ultimate control, huge ecosystem. Cons: verbose without wrappers.

Altair (Vega-Lite) — Clean grammar-of-graphics, light interactivity.

Use for: declarative specs, tidy data, quick linked interactions.

Pros: elegant, concise. Cons: data size limits unless configured.

Bokeh — Python-native interactive plotting (server-friendly).

Use for: interactive apps in Python, streaming data.

Pros: good for custom interactivity. Cons: styling can feel heavier than Altair/Plotly.

1 / 19
Use ← → arrow keys or Space to navigate