ADEME Database Worksheet
server management, pg_dump, pg_restore, backup
Part I : get started
connect to your server
- how do you restart your server ? check that it’s running ?
- connect to your server
- list the databases in the server
- show the tables in the
postgrestable
create database, restore data
- create a new
ademedbdatabase
The database was dumped with
pg_dump \
    -h localhost \
    --no-owner \
    --no-acl \
    --clean \
    --if-exists \
    --format=custom \
    --compress=9 \
    --file=ademe_backup.dump \
    ademedb
What is the equivalent pg_restore statement ?
psql postgres -c "CREATE DATABASE ademedb WITH ENCODING='UTF8';"
Restore
pg_restore \
    --no-owner \
    --no-acl \
    --clean \
    --if-exists \
    --dbname=ademedb \
    ademe_backup.dump
- what does the flag ‘’ do for pg_restore, what flag do you use for … / what flags do you need to restore with these conditions
- restore data from dump file with pg_restore
Part II: clean up
- drop some rows and reset index as sequential with window function ?
some queries that looks at empty labels notice that either dpe ghg labels are null or not null finds that energy use and ghg levels are zero also when labels are null drops empty labels
delete from dpe where dpe_label is null;
how many rows do you have
the id is no longer a serial
we need to reindex the id and set the sequence to start at new max
using row_numbers and a CTE set id as a new sequential number starting from
WITH numbered_rows AS ( SELECT id as old_id, ROW_NUMBER() OVER (ORDER BY id) as new_id FROM dpe ) UPDATE dpe SET id = numbered_rows.new_id FROM numbered_rows WHERE dpe.id = numbered_rows.old_id;
list the sequences with \ds
what is the next val of the sequence dpe_id_seq ?
select nextval(‘dpe_id_seq’::regclass);
reset the sequence to start at
– Reset the sequence
ALTER SEQUENCE dpe_id_seq RESTART WITH (SELECT MAX(id) + 1 FROM dpe);
Part exploration
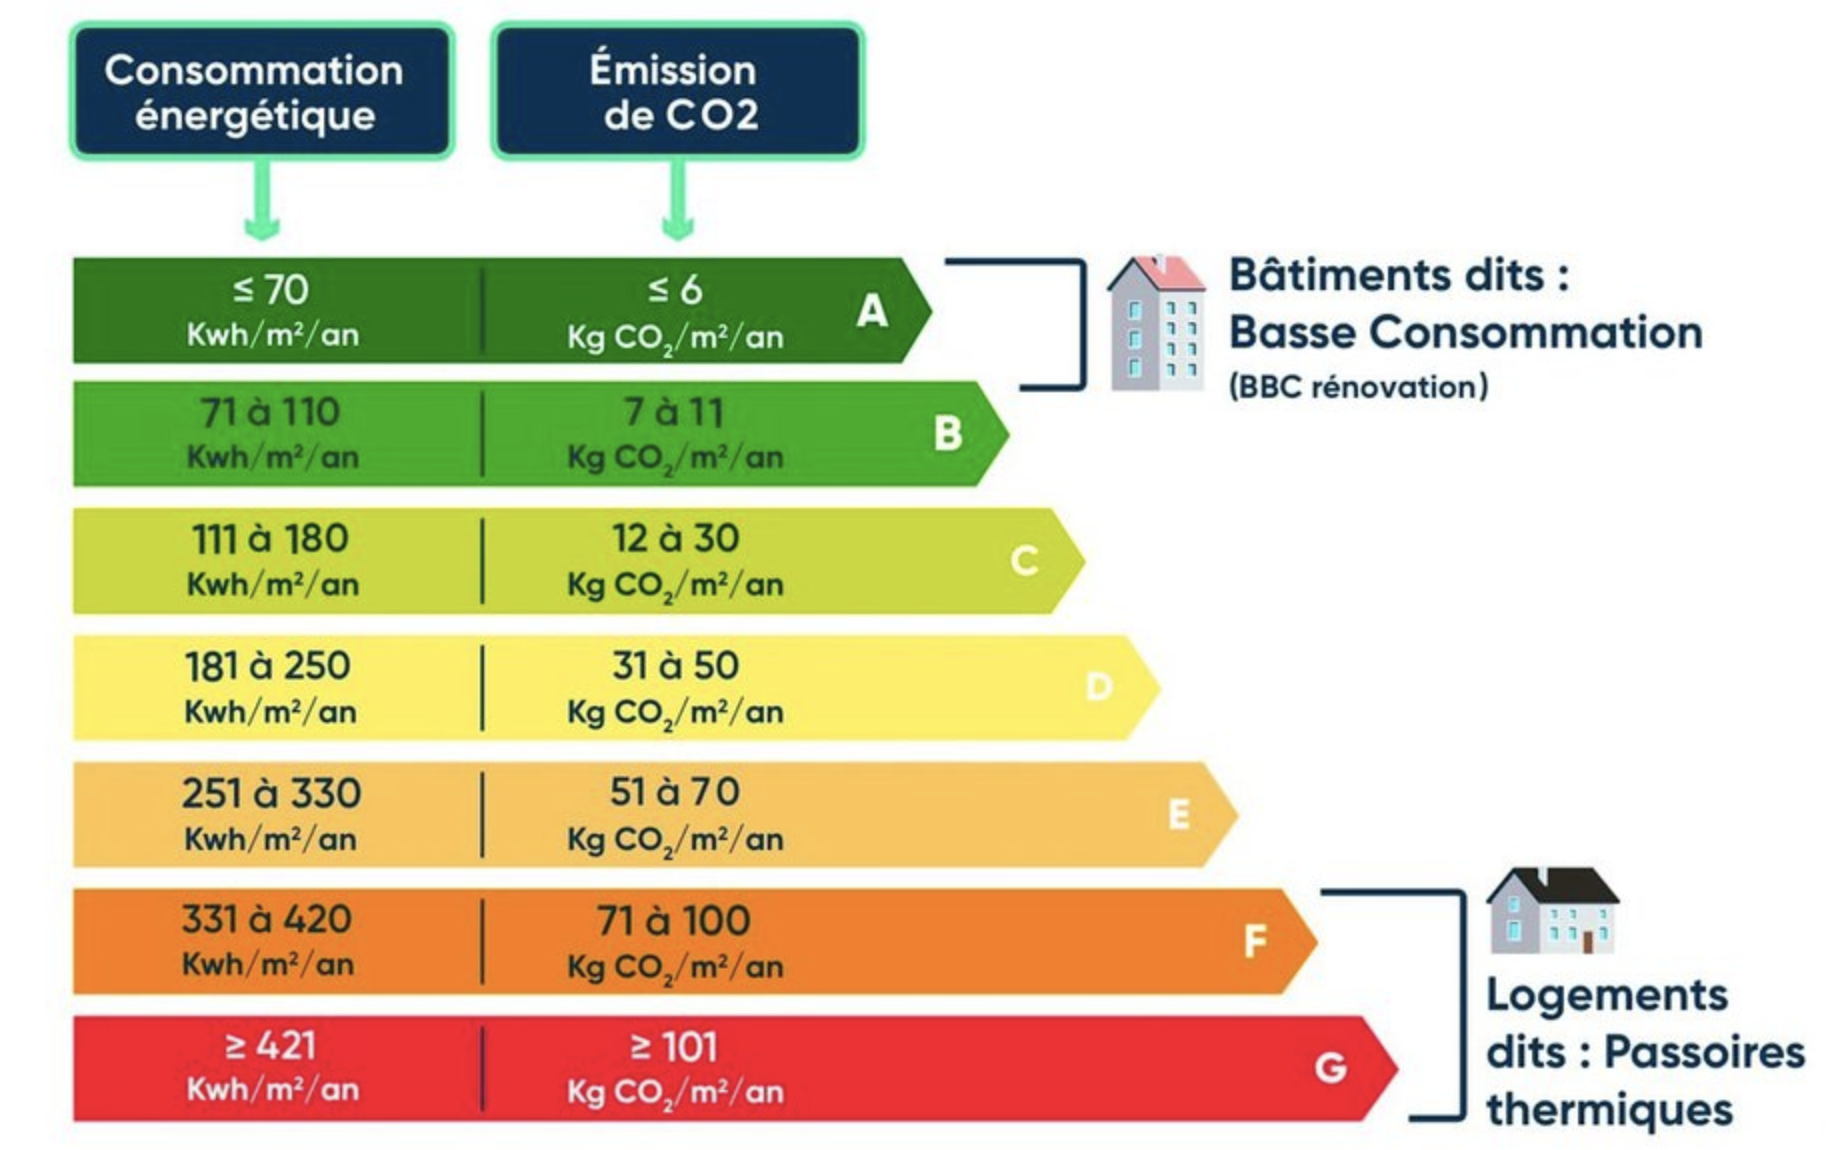
what can you infer about the rules between the labels and the energy_use_kwhepm2year and ghg_emissions_kgco2m2year
SELECT
    dpe_label,
    COUNT(*) as count,
    -- Energy use statistics
    ROUND(MIN(energy_use_kwhepm2year), 2) as min_energy_use,
    ROUND(MAX(energy_use_kwhepm2year), 2) as max_energy_use,
    -- GHG emissions statistics
    ROUND(MIN(ghg_emissions_kgco2m2year), 2) as min_ghg,
    ROUND(MAX(ghg_emissions_kgco2m2year), 2) as max_ghg
FROM dpe
WHERE
    dpe_label IS NOT NULL
    AND energy_use_kwhepm2year >0
    AND ghg_emissions_kgco2m2year >0
GROUP BY dpe_label
ORDER BY
    -- Assuming labels go from A to G
    dpe_label ASC;
does that confirm the rules for labels
using the energy labels table how many rows are mislabeled for dpe and ghg labels
how many rows are badly mislabeled ? (2 or more labels apart )
write a function that can tag the row as ok, wrong, terrible
is it consistent for DPE and GHG labels ?
is it getting worse or improving over the years extract the year from dpe_issue_date and count the numbers of mislabels and bad_mislabels for each year
Part III: Normalization
-
questions about goal of normalization NF1, NF2 … to refresh memory
- what columns are perfect for normalization ?
- apply
something about denormalization: labels for instance better to keep them in main table
apply : normalization on
- move all ban columns to ban table
- normalize final energy, primary energy cons
-
normalize energy types and costs
- fill in the blanks
Database Normalization Workshop: Energy Consumption Data
Duration: 90-120 minutes Prerequisites: Basic SQL knowledge, understanding of normalization concepts
Context
You’re working with a building energy diagnostic database that contains denormalized energy consumption data. Your task is to normalize this data and create meaningful queries to analyze it.
Initial Data Structure
-- Sample from dpe table showing denormalized columns
SELECT id,
       final_energy_cons_01, primary_energy_cons_01,
       final_energy_cons_02, primary_energy_cons_02,
       final_energy_cons_03, primary_energy_cons_03
FROM dpe LIMIT 3;
Part 1: Schema Design (15 mins)
Task 1.1: Analyze Current Structure
Look at the current table structure in dpe. What normalization problems do you see with the energy consumption columns?
Expected Answer Format:
- List at least 2 normalization issues
- Explain why they are problematic
Task 1.2: Design New Schema
Design a new table called energy_consumption that will store the data in a normalized way.
Requirements:
- Must have a serial primary key
- Must link back to the dpe table
- Must distinguish between final and primary energy types
- Must preserve the priority ordering (1,2,3)
❓ MCQ: Which of these designs best meets our requirements?
A) CREATE TABLE energy_consumption (
    dpe_id integer,
    final_energy numeric,
    primary_energy numeric
);

B) CREATE TABLE energy_consumption (
    id serial PRIMARY KEY,
    dpe_id integer REFERENCES dpe(id),
    priority smallint,
    measure_type text,
    consumption_value numeric
);

C) CREATE TABLE energy_consumption (
    dpe_id integer,
    priority smallint,
    energy_type text,
    PRIMARY KEY (dpe_id, priority, energy_type)
);
Checkpoint: At this point, you should understand why we need a new table and how it should be structured.
Part 2: Normalization
Task 2.1: remember CTEs ?
We’ll use Common Table Expressions (CTEs) to transform our data. Here’s an example pattern:
WITH transformed_data AS (
    SELECT id as dpe_id,
           1 as priority,
           'final' as measure_type,
           final_energy_cons_01 as consumption_value
    FROM dpe
    WHERE final_energy_cons_01 IS NOT NULL
)
SELECT * FROM transformed_data LIMIT 5;
Task 2.2: Write Transformation Query
Write a query that transforms all six energy consumption columns (final and primary, priorities 1-3) into rows.
Hints:
- Use UNION ALL to combine multiple SELECT statements
- Use two CTEs: one for final energy, one for primary
- Filter out NULL values
Expected Result Pattern:
dpe_id | priority | measure_type | consumption_value
-------+----------+-------------+------------------
1      | 1        | final       | 123.4
1      | 1        | primary     | 234.5
1      | 2        | final       | 145.6
Checkpoint: Your query should return rows with all combinations of:
- priorities (1,2,3)
- measure_types (final, primary) where consumption values are not null
Part 3: Implementation (30 mins)
Task 3.1: Create and Populate Table
Write the complete SQL script to:
- Create the new table with appropriate constraints
- Create necessary indexes
- Insert the transformed data
Checkpoint: After running your script, verify:
-- Should return count of rows by measure_type
SELECT measure_type, COUNT(*)
FROM energy_consumption
GROUP BY measure_type;
Task 3.2: Data Validation
Write queries to validate your data migration:
- Compare original vs. transformed data for a single dpe_id
- Check for any missing or duplicate records
- Verify referential integrity
Part 4: Analysis Queries (15 mins)
Task 4.1: Basic Analysis
Write a query to answer: “What is the average final vs. primary energy consumption for priority 1 measurements?”
Example Query Structure:
SELECT measure_type,
       AVG(consumption_value) as avg_consumption
FROM energy_consumption
WHERE priority = 1
GROUP BY measure_type;
Task 4.2: Advanced Analysis
Write a query to find buildings where primary energy consumption is more than twice the final energy consumption for the same priority.
Hints:
- Use self-join or window functions
- Consider handling NULL values
- Think about how to pair final/primary measurements
Bonus Challenge
Create a function that takes a dpe_id and returns a JSON object containing all energy consumption data for that building, structured hierarchically by priority and measure_type.
Final Checkpoint
You should now have:
- A normalized table structure
- Clean, transformed data
- Working validation queries
- Basic analysis capabilities
Submission Requirements
- Your schema creation SQL
- Your data transformation SQL
- Three validation queries
- Two analysis queries
- Results from all checkpoints
Index Optimization Exercise: Analyzing Building Energy Efficiency
Context
You are working as a data analyst for an environmental consulting firm. Your task is to analyze energy diagnostics data across France to identify patterns in building energy efficiency. However, some of your queries are running slowly and need optimization.
Part 1: Analyzing Building Energy Efficiency by Region
Initial Query
Write a query that finds the average energy consumption and count of buildings for each region, but only for buildings constructed after 2000 that have a DPE label of ‘A’ or ‘B’:
SELECT
    b.region_number,
    COUNT(*) as building_count,
    ROUND(AVG(d.energy_use_kwhepm2year), 2) as avg_energy_use,
    ROUND(AVG(d.ghg_emissions_kgco2m2year), 2) as avg_emissions
FROM dpe d
JOIN ban b ON d.id = b.dpe_id
WHERE d.construction_year > 2000
    AND d.dpe_label IN ('A', 'B')
GROUP BY b.region_number
ORDER BY avg_energy_use ASC;
Task 1.1: Analyze Query Performance
Run EXPLAIN ANALYZE on this query and record:
- The total execution time
- The type of scan used on each table
- The most expensive operation in the query plan
Task 1.2: Index Creation
Based on the query plan analysis:
- Which columns would benefit from an index?
- What type of index (B-tree or Hash) would be most appropriate? Why?
- Create the appropriate index(es)
Task 1.3: Performance Comparison
- Run EXPLAIN ANALYZE again with your new index(es)
- Calculate the performance improvement percentage
- Explain why the improvement occurred (or didn’t)
Part 2: Address Search Optimization
Initial Query
This query finds buildings with similar energy profiles within 1km of a given address:
SELECT
    b2.address,
    d2.dpe_label,
    d2.energy_use_kwhepm2year,
    ROUND(
        SQRT(POW(b1.x_coordinate - b2.x_coordinate, 2) +
             POW(b1.y_coordinate - b2.y_coordinate, 2))::numeric, 2
    ) as distance_km
FROM ban b1
JOIN dpe d1 ON b1.dpe_id = d1.id
JOIN ban b2 ON b1.id != b2.id
JOIN dpe d2 ON b2.dpe_id = d2.id
WHERE b1.address = '15 RUE DE LA PAIX PARIS'
    AND d2.dpe_label = d1.dpe_label
    AND SQRT(POW(b1.x_coordinate - b2.x_coordinate, 2) +
             POW(b1.y_coordinate - b2.y_coordinate, 2)) <= 1
ORDER BY distance_km;
Task 2.1: Analysis Questions
-
Why might this query be slow? [MCQ] a) Large number of joins b) Spatial calculation on every row c) Lack of indexes on join conditions d) All of the above
-
Which operations in the execution plan have the highest cost? Why?
Task 2.2: Index Optimization
- Create appropriate indexes to optimize this query
- Explain your choice of index type and columns
- Compare the execution plans before and after
Evaluation Criteria
- Correct index creation syntax
- Proper justification for index choices
- Accurate performance analysis
- Understanding of when each index type (B-tree vs Hash) is appropriate
- Quality of execution plan analysis
Expected Learning Outcomes
- Identify query patterns that benefit from indexing
- Choose appropriate index types based on query patterns
- Analyze query execution plans
- Measure and compare query performance
- Understand spatial query optimization